For weeks Peru suffers from unusual heavy rains, flooding and mudslides caused by an El Niño-like condition off the Peruvian coast with extreme warm ocean waters while elsewhere in the central and east central Pacific sea surface temperatures are about average.
This unusual phenomenon and the resulting extreme weather conditions are as well carefully monitored by the NASA using its Global Precipitation Measurement mission or the GPM constellation of satellites.
What is GPM?
Global Precipitation Measurement (GPM) is an international satellite mission that provides advanced information about snow- and rainfall on Earth from space. NASA and the Japanese Aerospace Exploration Agency (JAXA) launched the GPM Core Observatory satellite into space in February 2014. The satellite carries advanced instruments that transmit data to earth about where, when and how much rain and snow falls around the world.
The GPM mission contributes to give us a better understanding of how weather and climate impact our environment and the Earth's water and energy cycles and attempts to improve the forecasting of extreme events that cause natural disasters.
GPM examines rains in Peru
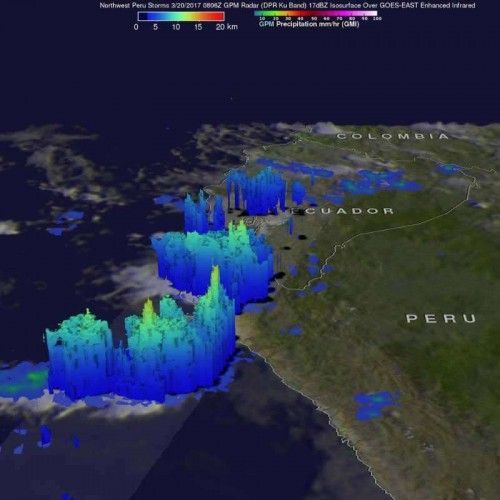
When the GPM observatory satellite flew over Peru on March 20, 2017 it overserved a band of storms dropping more than 137 mm (about 5.4 inches) of rain per hour over northwestern Peru which the researches classified as “extreme”.
The satellite as well examined the 3-D structure of the storms showing several storms located in the Pacific that had cloud tops reaching altitudes above 13 km (8.1 miles).
Between March 19 and 23 some areas in the provinces of Piura and Lambayeque had to cope with more than 150 mm per day (~6 inches), while the coastal zone of Piura, Lambayeque, Tumbes and the interior of La Libertad suffered from 50 mm (~ 2 inches) of rain per day – quite a lot for regions that saw immense rainfalls the weeks before already.
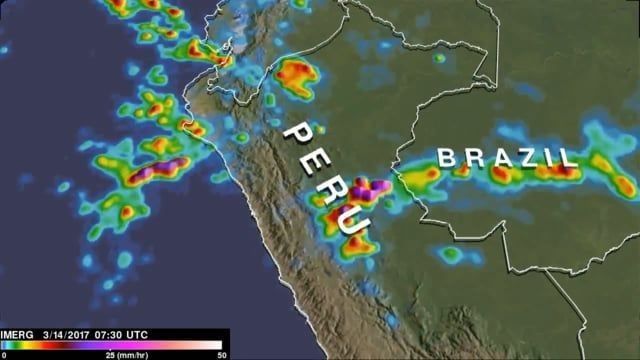
Using additionally other research and operational satellites, Nasa collected Peruvian rainfall data during a period from March 14 to 21, 2017 and visualized the results in an animation.
The animation shows rainfall rates between 25 mm (about 1 inch) and 50 mm (about 2 inches) per hour in some Peruvian areas, numbers that are quite high and explain the current situation in parts of the country.
Source: NASA.gov


